🦙 Let's go to the petting zoo! Alpaca picnic bag.
Late to the Party 🎉 is about insights into real-world AI without the hype.

Hello internet,
what a week! I’ve been working really hard to finish up my content for the ECMWF MOOC and wrote a massive piece on “quick wins” to make machine learning models in science. Let’s look at some other machine learning first, though!
The Latest Fashion
- You too can train Transformers at scale like Microsoft trained Bing
- How to achieve success in an ML PhD? Just know stuff (maybe)
- Arxiv teamed up with Hugging Face to bring implementation right to you on Arxiv
Got this from a friend? Subscribe here!
My Current Obsession
I have been working on something big: ML.recipes
It’s a guide to creating better ML in science with guides and code examples, and through this, increase citations, ease review & foster collaboration. It grew out of the tutorial I held at Euroscipy and the workshop at Pydata, but I have put a lot of effort into expanding the content to present you with “easy wins” to use in your day-to-day.
(The secret is that most people outside of science could equally benefit from it, but one audience at a time.)
I already had people in medicine, astrophysics, and geology look at this and tell me how useful they found it. So, if you have a second, consider sharing it with your colleagues!
Also, next week tier 2 of the ECMWF MOOC on machine learning for weather and climate prediction starts. It’s open, and free, and we worked hard to bring you the highest quality.
Thing I Like
I bought one of these Thors Hammer fidget toys, and I can’t stop spinning it. Very fun! Highly recommended.
Hot off the Press
I published a piece on nine ways I overcome imposter syndrome as a neurodivergent person.
As mentioned above, ml.recipes now exists!
In Case You Missed It
My post on my 10 favourite VS Code extensions is making the rounds again.
Machine Learning Insights
Last week I asked, How can you normalise data with outliers?, and here’s the gist of it:
Normalising data with outliers is challenging. Traditional normalisation methods like min-max scaling or z-score normalisation are affected by the presence of outliers, leading to skewed results. These are some approaches that you can use to normalise data with outliers:
-
Robust Scaler: This normalisation technique is more resistant to outliers. This scaler scales the data according to the interquartile range (IQR), which is the difference between the 75th percentile (Q3) and the 25th percentile (Q1) of the data. The formula for the robust scaler is:
(x - Q2) / (Q3 - Q1)
Where x is the value to be scaled, Q2 is the median, and Q1 and Q3 are the first and third quartiles, respectively.
-
Winsorisation: This technique replaces extreme values with the closest values that are not outliers. For example, if the 90th percentile is an outlier, it can be replaced with the 89th percentile value. This method preserves the overall shape of the distribution, but it also changes the range of the data. Questionable sometimes, but it’s predominantly used with survey responses.
- Clipping: Clipping is similar to Winsorization, but instead of replacing outliers, it caps the values at a certain threshold. For example, if the maximum threshold is set at the 95th percentile, any value above that threshold is capped at the 95th percentile value.
- Log transformation: Transformations can help normalise data with outliers. Taking the logarithm of the data potentially compresses the range of the data, making it easier to normalise using traditional methods.
In general, the choice of normalisation method depends on the specific characteristics of the data and the objectives of the analysis. It is essential to carefully evaluate the impact of outliers on the data before choosing a normalisation method.
Data Stories
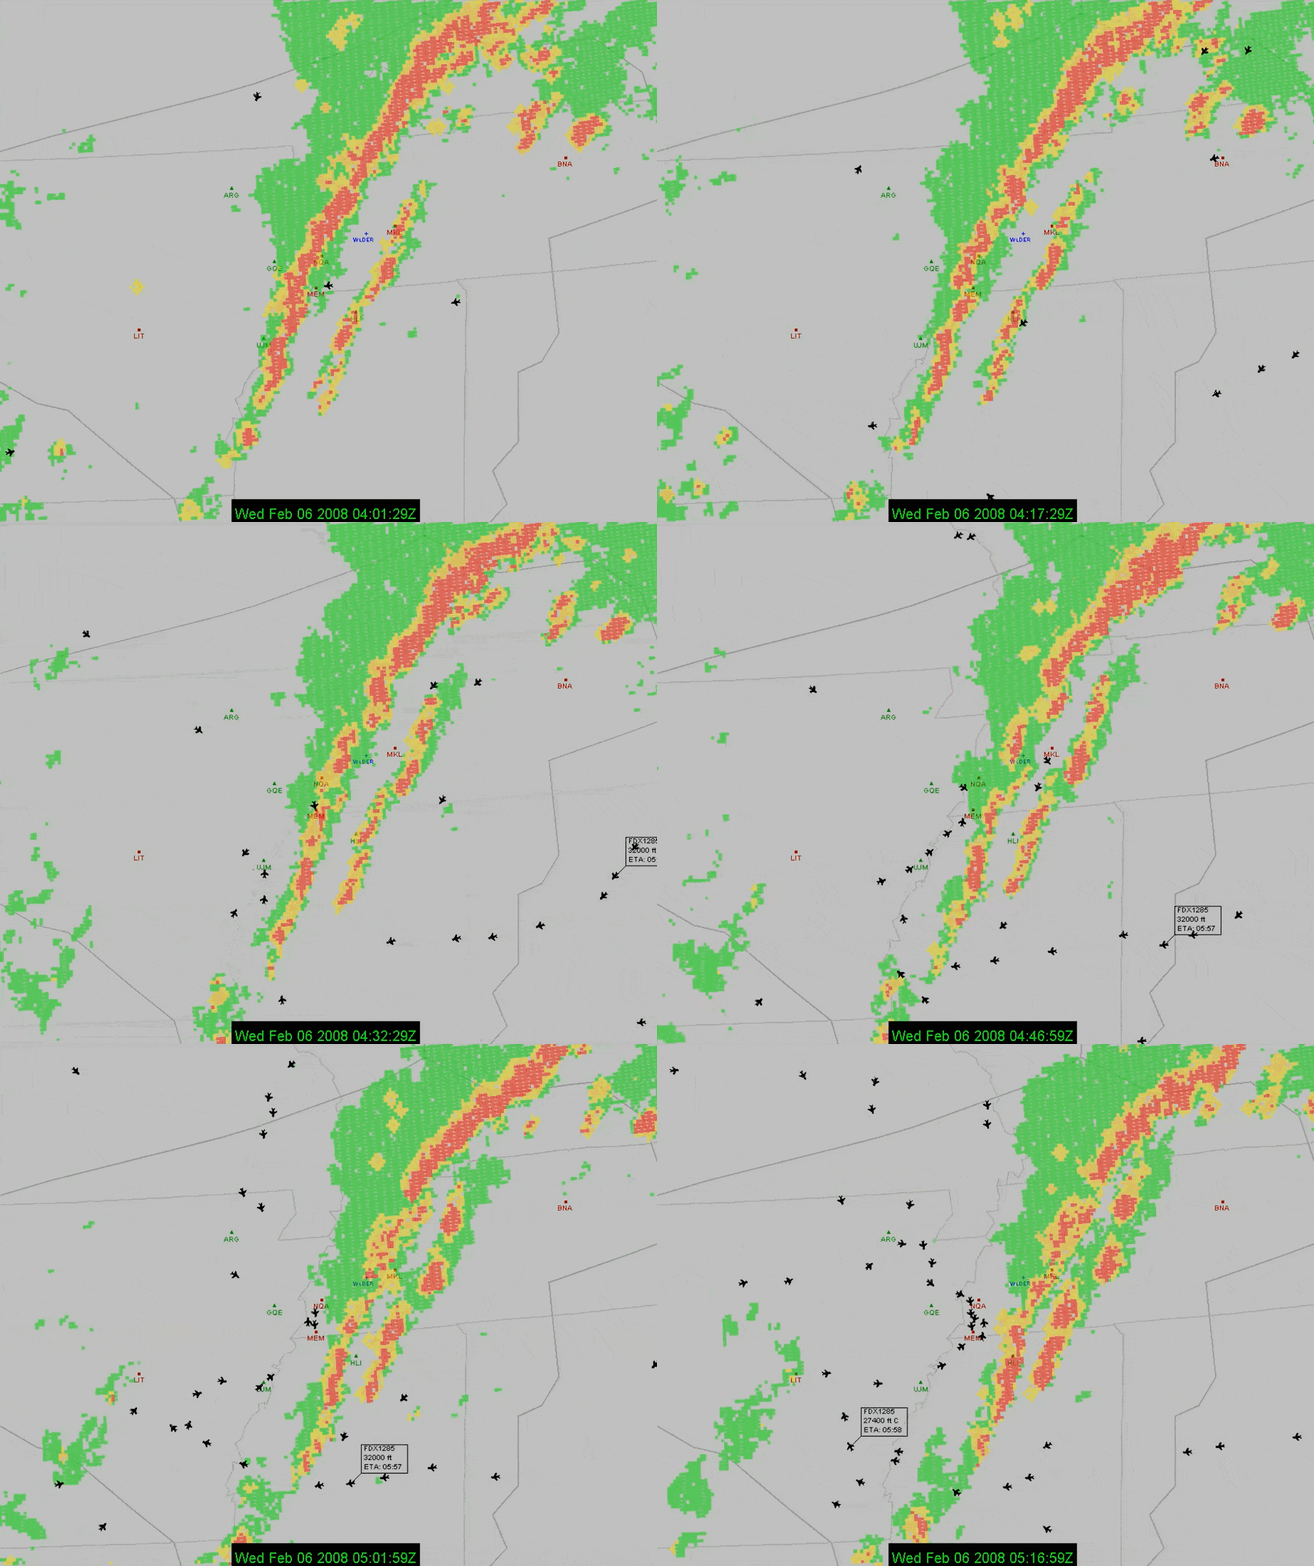
Memphis is one of the FedEx hubs.
The visualisation below shows what happens when a storm passes over the airport. We can see some of what I expect to be express and high-priority planes weave through the storm fronts. But then, when it’s finally passed over, we can see the swarm of planes land.
Just very fun to look at.

Source: Youtube
Question of the Week
- What is the p-value, and how is it relevant in statistics?
Post them on Twitter and Tag me. I’d love to see what you come up with. Then I can include them in the next issue!
Tidbits from the Web
- There’s a reason we all need subtitles now
- This app tries to attribute stable diffusion outputs to original artists
- Peer review has some problems, so how does it fail?
Add a comment: