🐱👤 I took things literally, until I got arrested for theft
Late to the Party 🎉 is about insights into real-world AI without the hype.

Hello internet,
What a week! I have been publishing a video a day, so let’s dive into some machine learning for more inspiration!
The Latest Fashion
- An Introduction to Data-Centric AI by MIT on Youtube
- MatPlotX, Matplotlib but make it ✨stylish✨
- A fantastic list of Awesome Diffusion Models
Got this from a friend? Subscribe here!
My Current Obsession
This week I have been plotting some things behind the scenes for Skillshare. They’re quite interested in more ethically-conscious treatments of AI it seems. Love to see it. Maybe I can make this work to get this information to spread across disciplines.
I’ve also had an extremely satisfying week at work. It looks like my priorities are shifting a bit, and I feel much more integrated into working on things that truly matter at ECMWF. Big things are coming!
Thing I Like
This Desktop camera mount has been incredibly useful for creating the Tiktoks. Just slide my monitors apart, turn on the camera and I’m good to go!
Hot off the Press
I set myself a challenge to publish a Tiktok / Short every day, and so far, I have been killing it. (Also in part due to the encouragement by Michal in the Latent Space).
- What is deep learning?
- Gaining insights into data by clustering
- How the TikTok Algorithm chooses videos for you
- The secret to getting more data for free from your existing data
- How AI can understand emotions in your salty tweets
I also published new CfPs on pythondeadlin.es for euroScipy, PyCon Israel, PyCon Poland, PyCon Taiwan, PyCon Korea, and PyCon Estonia. The conference dates for Pycon ES, PyCon UK, PyCon Portugal and PyCon Brasil are also in, but we don’t have CfPs yet!
I’m thinking I should start adding Twitter handles to these conferences for easier access. But wondering how long Twitter will survive… (I’d do Mastodon, but some conferences don’t even do Twitter…. soooo not sure.)
In Case You Missed It
Vicki Boykis retweeted my ML Recipes, which gave it some nice attention!
Machine Learning Insights
Last week I asked, What is imbalanced data and what are its implications?, and here’s the gist of it:
Imbalanced data is a common challenge that arises when working with datasets that have some disparity in the number of observations between the different classes or categories. This commonly occurs in many real-world applications, including meteorological data and geoscience.
For example, let’s consider a dataset that contains historical data about hurricanes in a region. Suppose that over the past 10 years, there were only 3 major hurricanes (i.e., Category 3 or higher) and 97 minor hurricanes (i.e., Category 1 or 2). This would result in a highly imbalanced dataset, with a majority of the observations belonging to the minor hurricane class and very few belonging to the major hurricane class.
The implications of imbalanced data can be significant. When we train a machine learning algorithm on this dataset to predict the severity of a future hurricane, the algorithm may perform poorly because it will be biased towards the majority class (i.e., minor hurricanes) and may not have enough information to accurately predict the minority class (i.e., major hurricanes). In other words, the algorithm will be more likely to predict a minor hurricane, regardless of the actual outcome.
Moreover, even if the algorithm performs well on the majority class, its overall accuracy may still be low if it performs poorly on the minority class. This is because the number of observations in the minority class is small, and each incorrect prediction can have a significant impact on the overall accuracy of the model. In fact, people get tricked into reporting a 97% model accuracy all the time!
We can address the issue of imbalanced data. There are several techniques that can be used, including resampling the data to balance the classes, using cost-sensitive learning to assign different misclassification costs to the different classes, and using ensemble methods that combine multiple models to improve the overall performance.
Data Stories
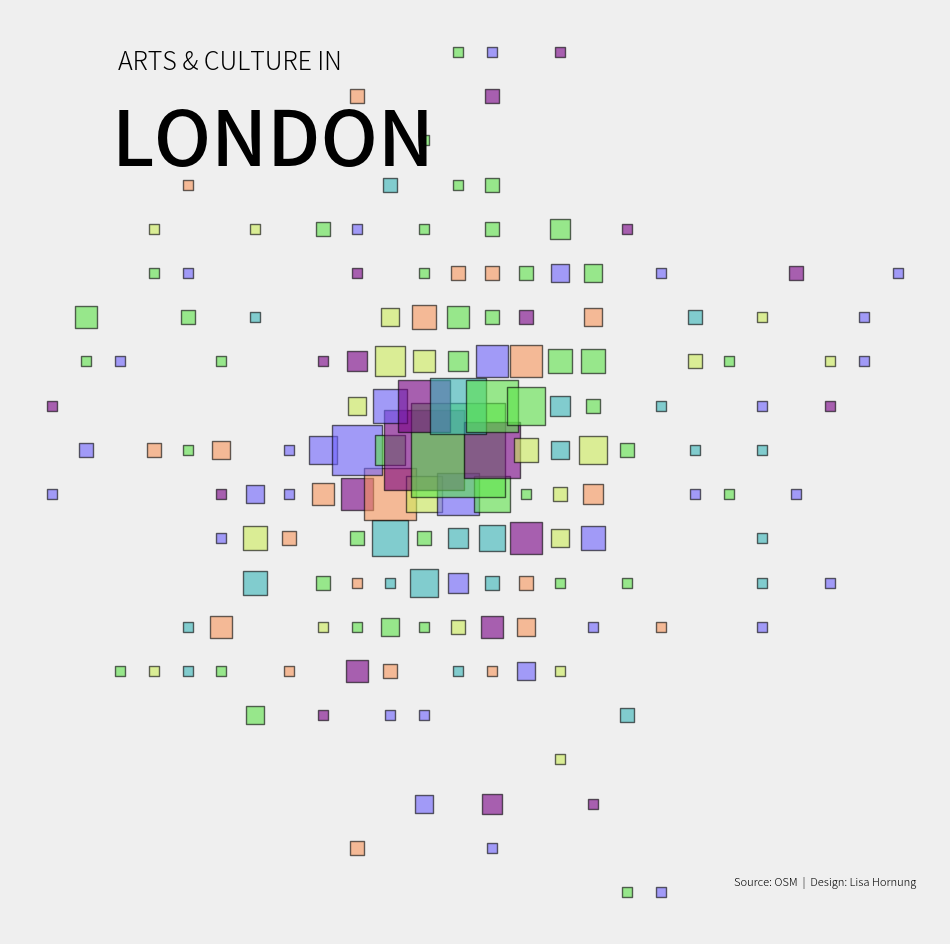
What’s a good place in London to enjoy arts and culture?
Lisa Hornung explored this question visually with this abstract map (as one of many cool maps). Lots of things to do around Covent Garden, obviously, but check out the source for an exploration in code!

Source: Lisa Hornung/OSM
Question of the Week
- What is correlation?
Post them on Mastodon and Tag me. I’d love to see what you come up with. Then I can include them in the next issue!
Tidbits from the Web
- For neurodivergent people like ADHDers, this video on designing your environment changed how I do things
- The internet exploded over this well thought-though LaTeX alternative: Typst
- How Sebastian Raschka keeps up with machine learning these days
Add a comment: